
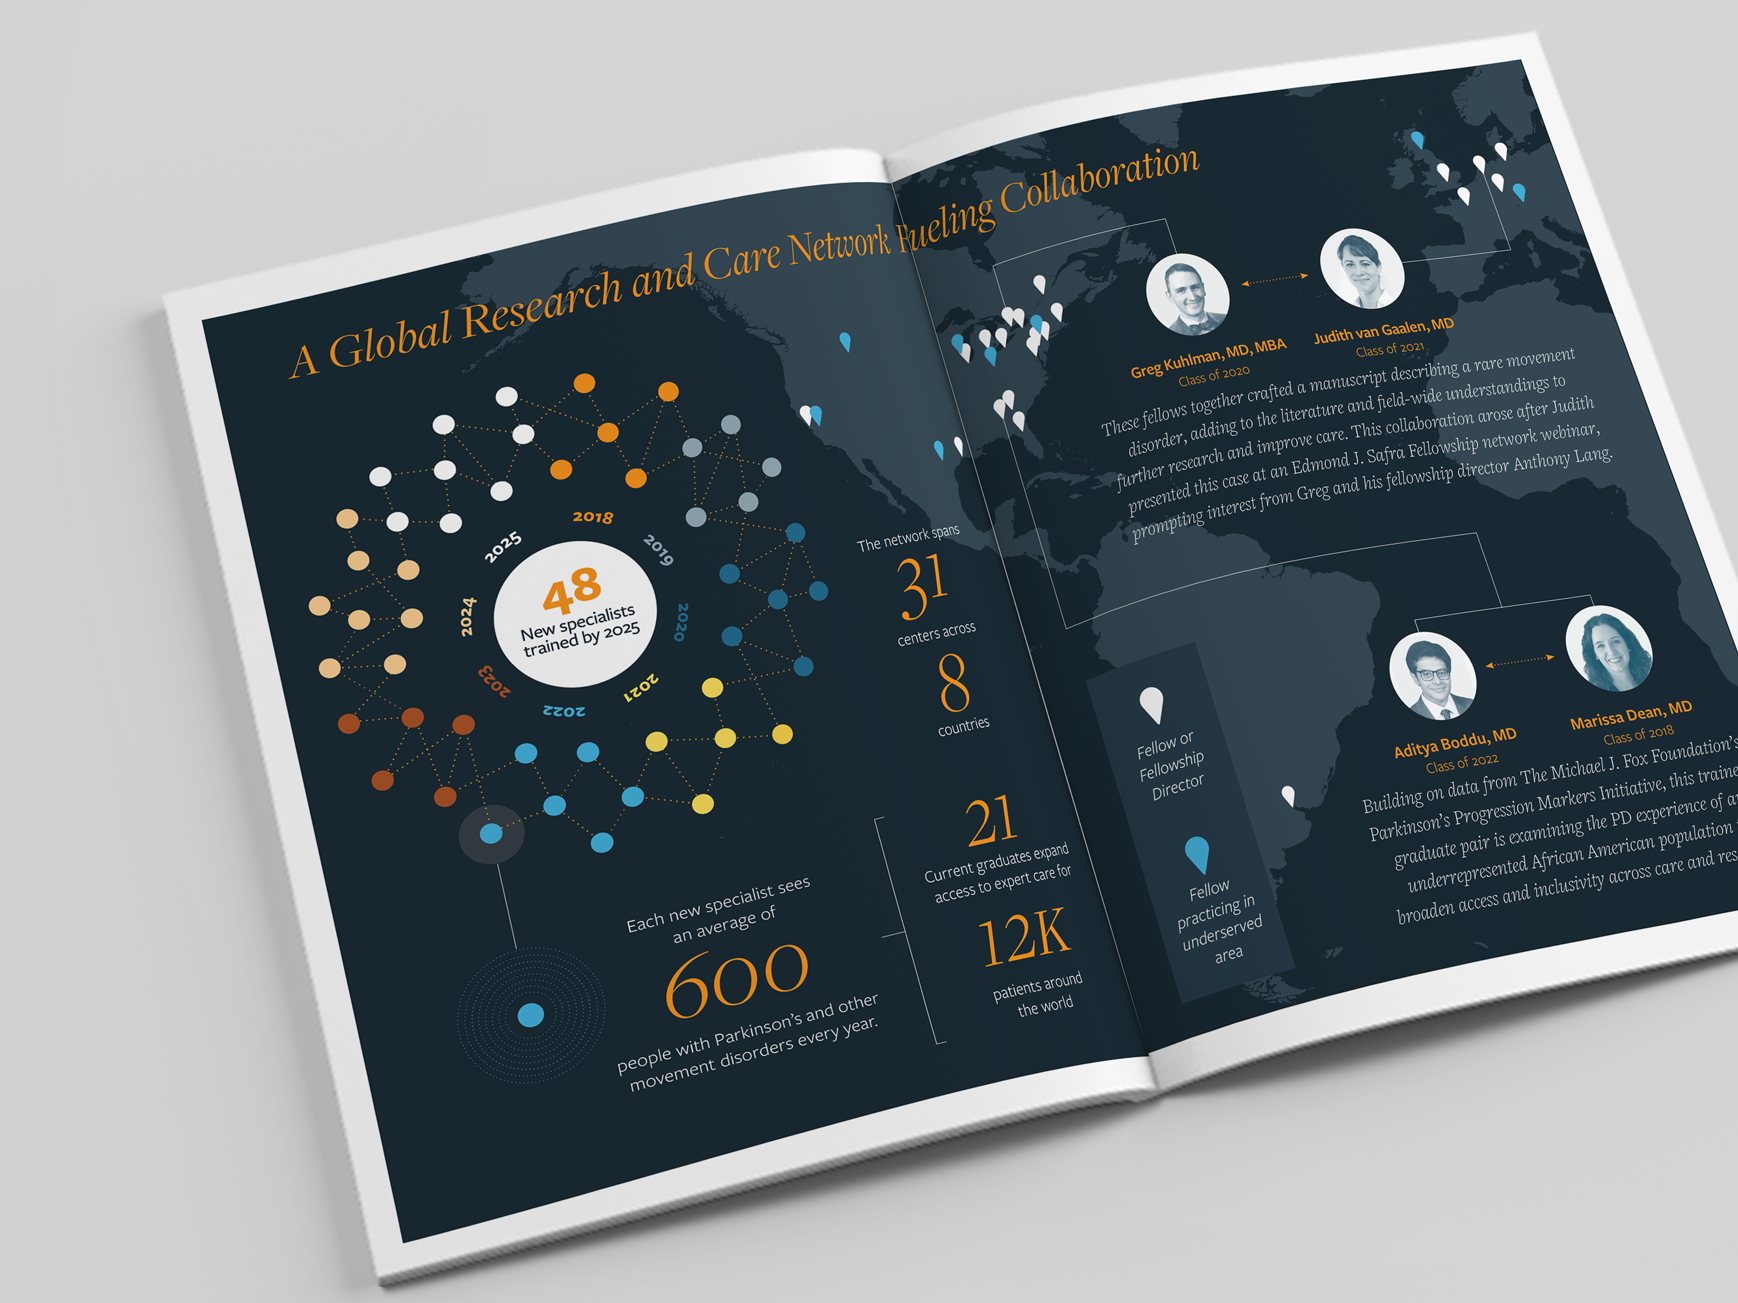


The Edmond J. Safra Fellowship in Movement Disorders funds medical centers around the world to train new movement disorder specialists. As part of a publication highlighting recent graduates of the program, we created an infographic to show both the impact and scope of the Fellowship. We also created a digital version of the graphic for social media audiences.
The graphic demonstrates how the program is catalyzing change in the field by helping build a growing global network of movement disorder specialists who will be more accessible to patients.
Anecdotes and a detailed map show the real, human side of the impact of the program on patient lives.
When COVID hit in 2020, The Michael J. Fox Foundation jumped into action, creating an online clinical study to identify the effects of the pandemic on the Parkinson’s community. We were tasked with creating an infographic for digital platforms to share out the results of this first-of-its-kind study.
We used simplified illustrations and graphs to highlight the impressive reach of the study, and the high-level findings of how having COVID has impacted the Parkinson’s symptoms of those surveyed.
We closed with an emphasis on new and existing barriers to care, including those in low income and BIPOC communities.
The Alzheimer's Drug Discovery Foundation (ADDF) created a Clinical Trials Report in 2017 to provide a comprehensive picture of Alzheimer's drugs in clinical development. To make these data-rich findings more digestible, and to help tell a larger story of the state of the field, we presented the bulk of the findings as infographics.
This infographic tells the story of the Foundation’s role in funding late-stage Alzheimer’s research, within the context of the entire clinical trials pipeline.
A few more snapshots of the different ways we visualized complex data, often telling multi-layered stories to convey big-picture take-aways along with nitty-gritty details. In this way, this report was an invaluable resource to both the scientific community and the millions of people who stand to be impacted by their work.
This infographic uses icons and color coding to map the various behavioral symptoms being targeted by different drugs in clinical trials.